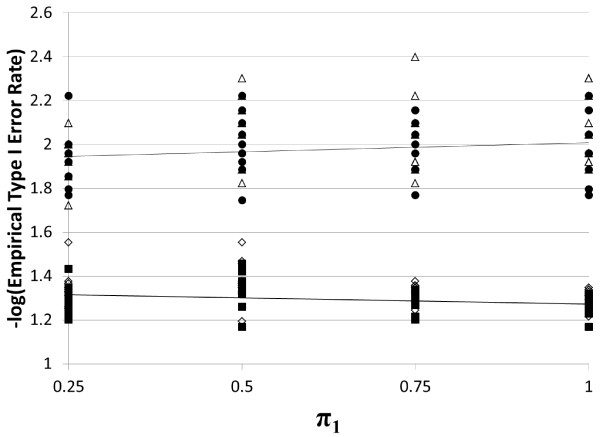
Figure 1.
Empirical type I error rates for TDT-HET and TDT statistics. Here we present the empirical type I error rates for the TDT-HET and TDT statistics for different settings of the prevalence (0.05 or 0.15), DAF (0.10, 0.25, 0.50, 0.75, 0.90), π1 (0.25, 0.50, 0.75, 1.00) at two different significance levels (5%, 1%). The various plotted shapes in the figure represent empirical type I error rates (-log-transformed) for a fixed setting of the parameters. Solid square = TDT-HET, 5% Empirical Type I Error Rate. Hollow diamond = TDT, 5% Empirical Type I Error Rate. Solid circle = TDT-HET, 1% Empirical Type I Error Rate. Hollow triangle = TDT, 1% Empirical Type I Error Rate.

