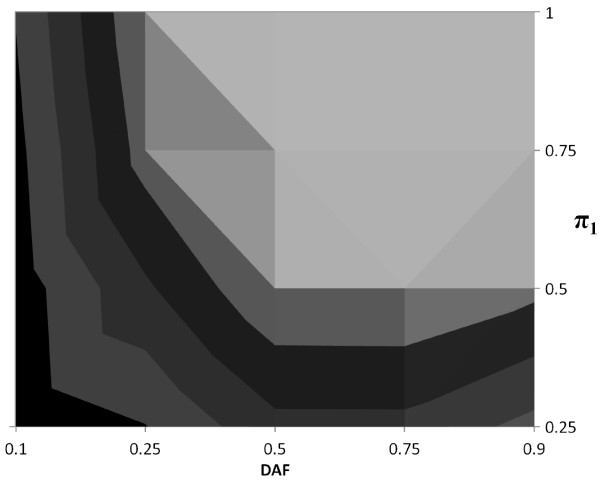
Figure 4.
Contour plot of TDT-HET empirical power for Recessive MOI at 5% significance level. Empirical powers at the 5% significance level for prevalence (ϕ) equal to 0.05; DAF (p) equal to 0.10, 0.25, 0.50, 0.75, 0.90 and π1 equal to 0.25, 0.50, 0.75, 1.00. Each contour in the figure represents a range of empirical power values. There are five contours, corresponding to power ranges (x, x + 0.20), where x = 0.00, 0.20, 0.40, 0.60, 0.80. For example, the black contour represents the power range (0.00, 0.20). The light gray contour contiguous to the black contour represents the power range (0.20, 0.40) and so forth. The lightest contour represents the power range (0.80, 1.00).

