
Figure 4.
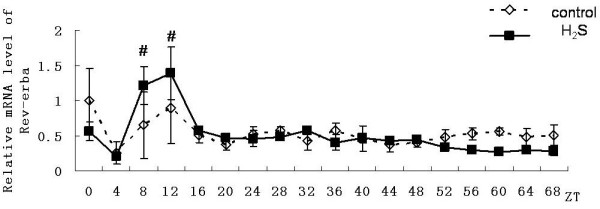
Effect on expression of Rev-erbα gene in primary cultured hepatocytes. Horizontal axis shows the period and vertical axis shows the amplitude. The mRNA levels of Rev-erbα gene were normalized to GAPDH mRNA. Each value represents the mean ± SD (n = 3). The expression differences were assessed by one-way ANOVA.