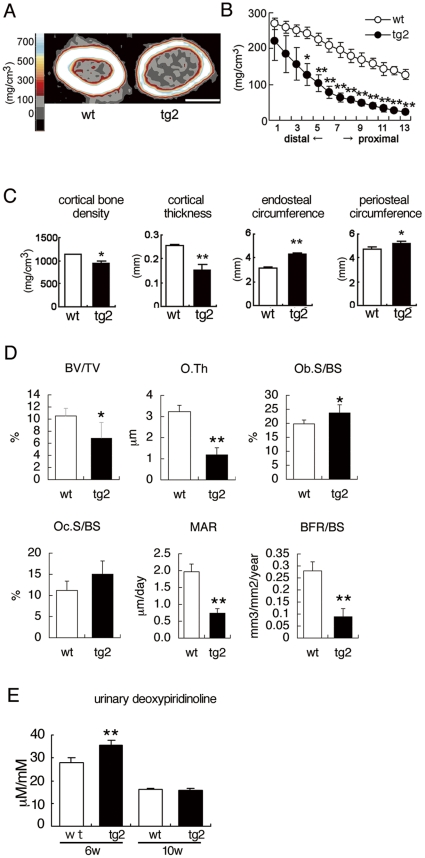
Figure 4. pQCT and bone histomorphometric analyses and bone resorption markers.
(A–C) pQCT analyses of femurs from wild-type (wt) and tg2 mice at 10 weeks of age. A, pQCT images of the diaphyses of the femurs. Bar: 1 mm. B, The trabecular bone density in 13 equal cross-divisions of the metaphysial parts of the femurs was measured in wild-type (open circles) and tg2 (closed circles) mice. C, Cortical bone density, cortical thickness, endosteal circumference, and periosteal circumference of the diaphyses of the femurs were measured in wild-type (open columns) and tg2 (closed columns) mice. n = 5. (D) Bone histomorphometric analysis. Trabecular bone volume (bone volume/tissue volume, BV/TV), osteoid thickness (O.Th), osteoblast surface (Ob.S/BS), osteoclast surface (Oc.S/BS), mineral apposition rate (MAR), and bone formation rate (BFR/BS) were compared at 10 weeks of age. BS, bone surface. n = 5. (E) Urinary deoxypyridinoline levels at 6 and 10 weeks of age. n = 7–11. *P<0.05 and **P<0.01 vs. wild-type mice.

