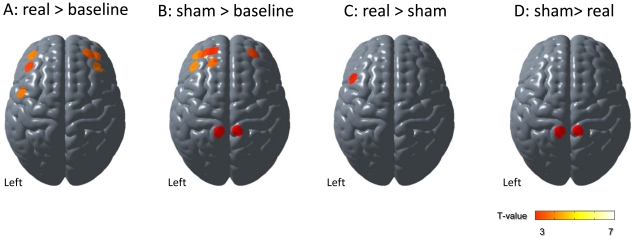
Figure 6. Cortical mapping of motor imagery–related activation.
Results from second-level random effect analysis of comparisons between real feedbacks vs. baseline (A), between sham feedback vs. baseline (B), real vs. sham feedback (C), and sham vs. real feedback (D). Within-subject comparison between feedback conditions revealed significantly increased cortical activation in the left lateral premotor cortex under real feedback conditions compared with sham feedback conditions, as well as significantly increased activation in the bilateral parietal association cortex under sham feedback conditions compared with real feedback conditions.

