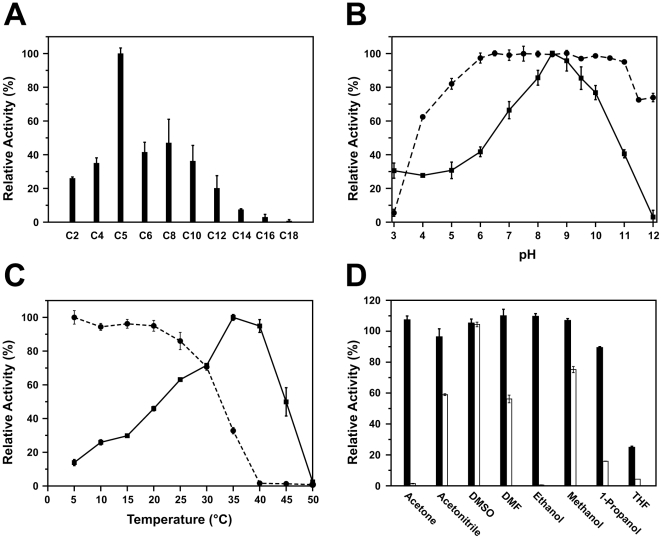
Figure 3. Effect of substrate, pH, temperature and organic solvents on EstC activity.
A) Substrate discrimination by EstC. Enzyme activities are expressed relative to an optimal activity observed with substrate pNP-C5 (100% = 6.0±0.2 U/mg). B) Effect of pH on EstC activity. The solid line (squares) represents relative activity as a function of pH. The dashed line (circles) represents the residual activity after a 1-hour preincubation of the enzyme at various pH values. Enzyme activities are expressed relative to a maximal activity observed at pH 8.5. C) Effect of temperature on EstC activity. The solid line (squares) represents relative activity as a function of temperature. The dashed line (circles) represents the residual activity after a 1-hour preincubation of the enzyme at various temperatures. Values are expressed relative to a maximal activity observed at 35°C. D) Effect of organic solvents on EstC activity. Solid bars represent the residual activity after a 1-hour pre-incubation of the enzyme in 10% (v/v) of each organic solvent. Open bars represent residual activity after a 1-hour pre-incubation in 30% (v/v) of each organic solvent. Activities are calculated relative to a control enzyme incubated in the same conditions without organic solvent.

