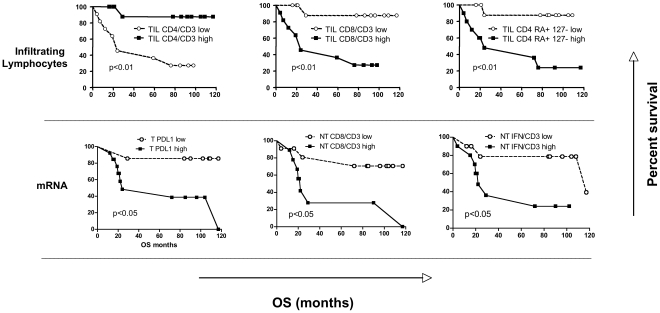
Figure 3. Kaplan-Meier curves of overall survival (OS) among HCC patients.
Prognostic significance of the frequency of tumor infiltrating lymphocytes (TIL) are shown in the upper part of the figure. mRNA expression of PDL1 in tumor and of CD8 and IFN-γ in nontumorous liver is shown in the lower part of the figure. Low, high: lower or higher than median value. P values were determined by the log-rank test.

