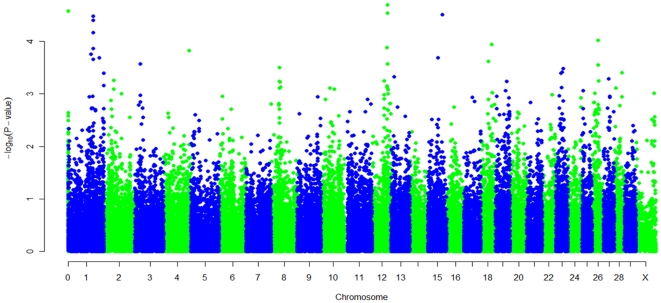
Figure 1. Manhattan plot displaying the −log10(p-value) results of the genome wide scan (Group A).
Manhattan plot displaying the −log10(p-value) results of the genome-wide scan using the GRAMMAR-GC method with respect to their Btau4.0 genomic position for an association with Mycobaterium avium subspecies paratuberculosis defining a case as an animal that is MAP ELISA or tissue positive and a control as an animal that is MAP ELISA or tissue negative (Group A).

