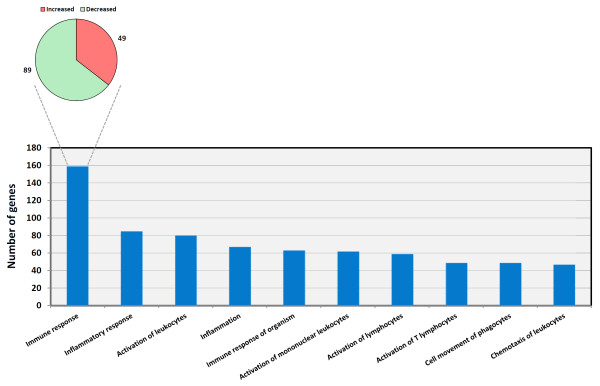
Figure 3.
Sub-categories of the top ranking IPA-identified inflammatory response gene ontology (GO) category. The numbers of genes displaying increased and decreased relative expression for affects immune response, the top ranking subcategory, are shown. The number of differentially expressed genes within each functional subcategory is indicated.

