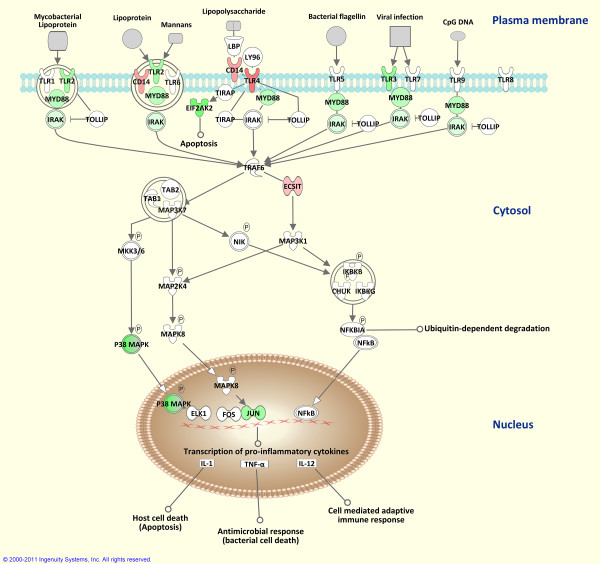
Figure 4.
Differential gene expression in the TLR signalling pathway. Genes within the TLR signalling pathway showing differential expression are highlighted in colour. Colour intensity indicates the degree of increased (red) or decreased (green) relative expression in the BTB group compared to the control animal group. A white colour indicates genes that were not differentially expressed and entities coloured grey represent microbial PAMPs.

