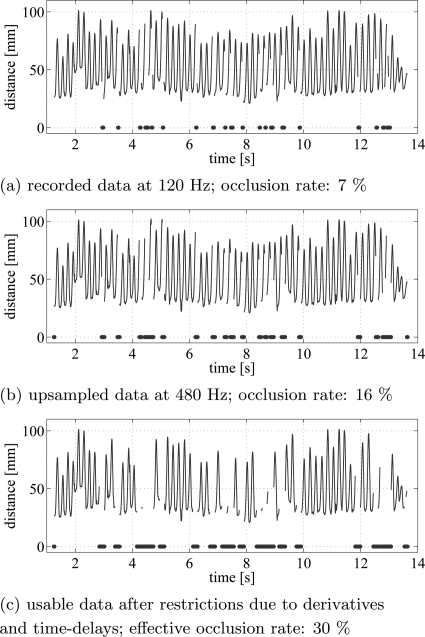
Figure 1.
(Color online) Distance between thumb and index finger markers are plotted over time. Example of a time series with 7% occlusions in the recorded data (a). The dots denote the occluded points. The upsampled data (b) have an occlusion rate of 16%. In (c) after removing all effective occlusions, 70% of the original data is usable.

