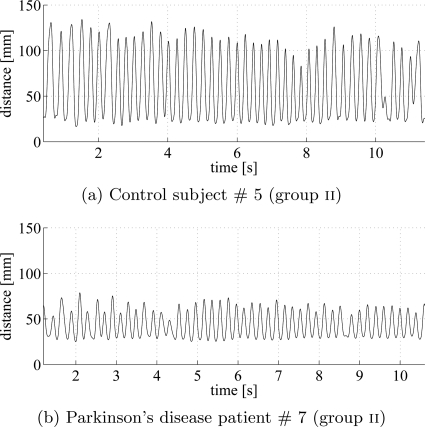
Figure 2.
Time series of the distance between the thumb and the index finger during the individual finger tapping for a control subject (a) and a PD patient (b) from group ii. The sampling rate equals to 480 Hz. Note, that the PD patient has much reduced movement amplitude. However, there was substantial overlap in movement amplitude between the control subjects and PD patients and amplitude alone was not sufficient to discriminate the groups.

