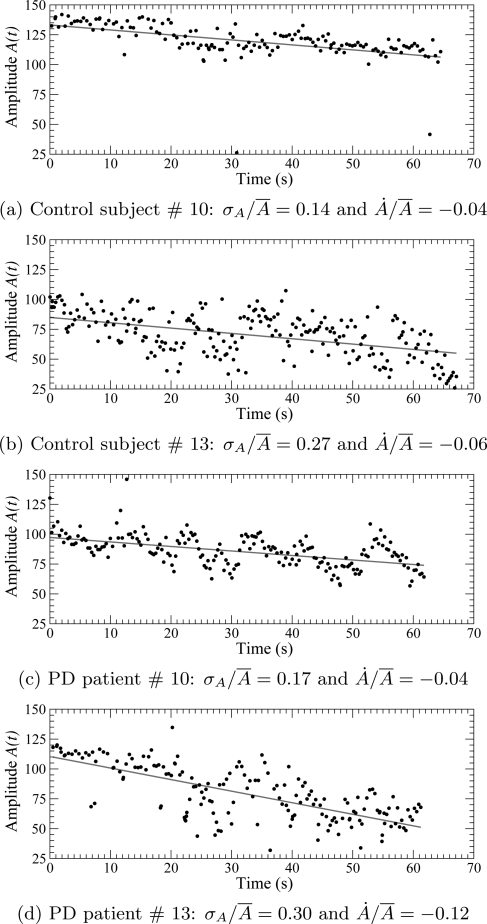
Figure 3.
(Color online) Amplitude versus time for individual finger tapping by control subjects—(a) and (b)—and by PD patients—(c) and (d)—from group ii. The six 10 s sessions are concatenated to exhibit the tendency. Linear regression is shown as a red line. is the slope of the regression line and is the mean amplitude.

