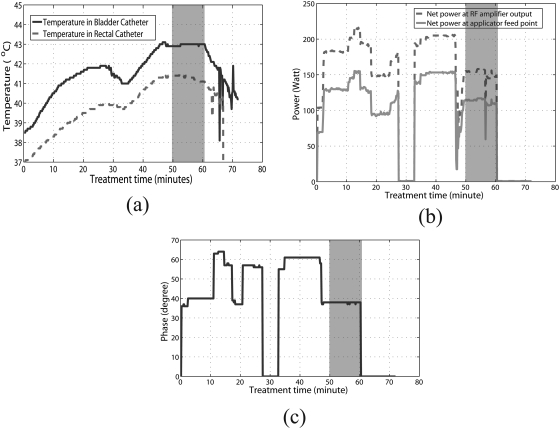
Figure 2.
(a) Measured bladder (solid line) and rectal (dashed line) temperatures as a function of time in the thermochemotherapy treatment. (b) Net power at the RF amplifier output (dashed line), net power at the applicator feed point (solid line), and (c) phase information as a function of treatment time. Note that (b) and (c) are for just one of the four antennas of the applicator.

