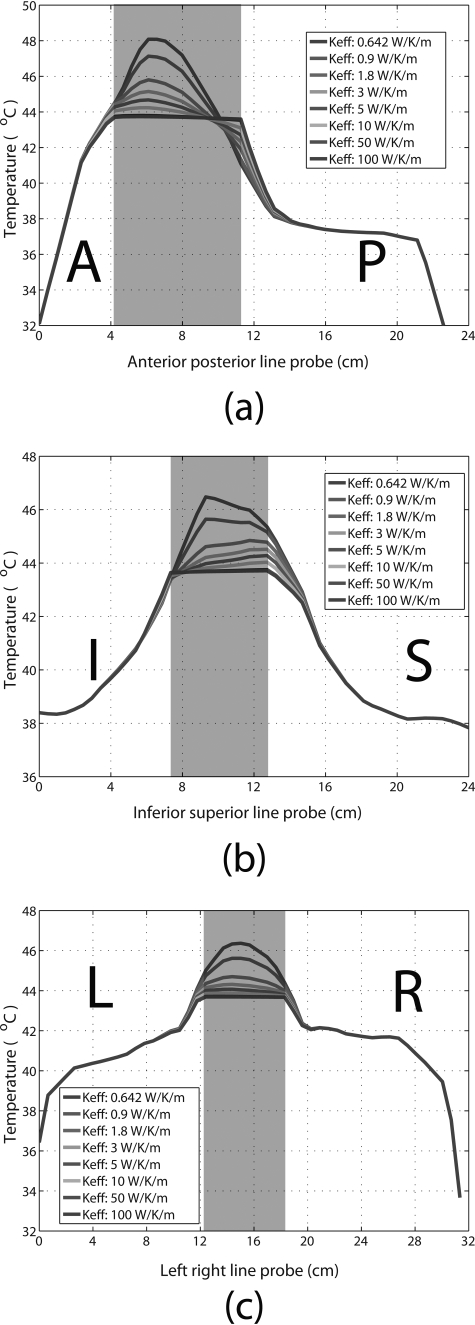
Figure 7.
Temperature distribution profiles across the bladder and surrounding tissues in the (a) anterior–posterior, (b) inferior–superior, and (c) left–right directions, with various bladder values used for in the planning. The shaded regions represent the bladder. (A = anterior, P = posterior, I = inferior, S = superior, L = left, and R = right).

