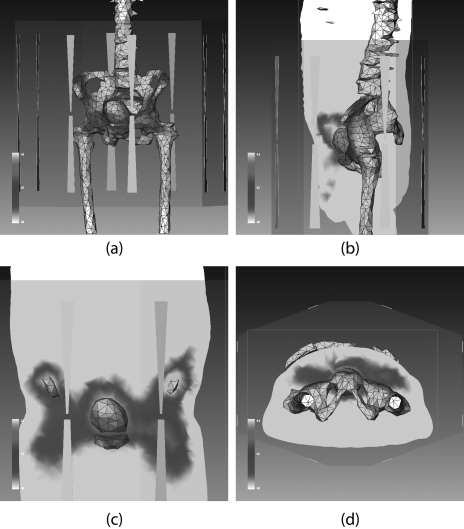
Figure 8.
Demonstration of Sigma-HyperPlan simulated temperature distributions in one patient (patient 3) when the clinical setting was used: (a) three dimensional temperature distribution superimposed on the anatomy showing location of bladder and bones. Temperature distributions on the sagittal plane, coronal plane, and axial plane are illustrated in (b), (c), and (d), respectively.

