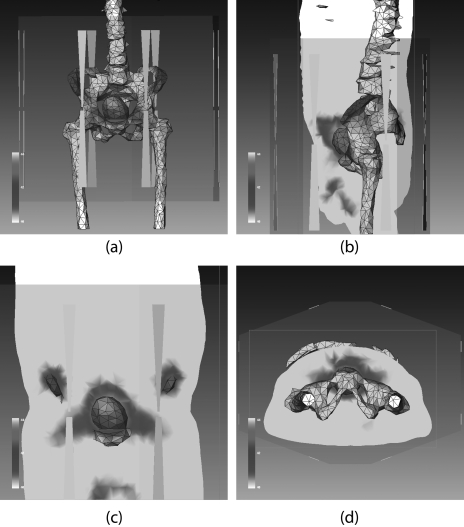
Figure 9.
Sigma-HyperPlan simulated temperature distribution in patient 3 (same as in Fig. 8) when the computed-optimal setting is used: (a) three dimensional temperature distribution in bladder and pelvic bones. Temperature distributions on the sagittal, coronal, and axial planes are illustrated in (b), (c), and (d), respectively. Comparing against Fig. 8, the hot spots are substantially reduced with the computed-optimal setting.

