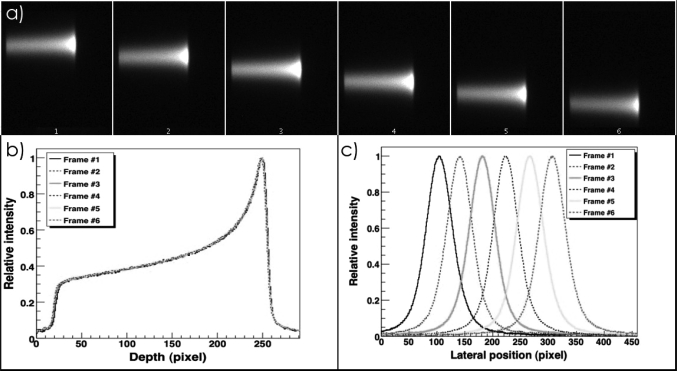
Figure 2.
(a) A sample of the images of proton spots acquired with the CCD camera. Each frame represents a different proton spot of a nominal range in water of 10.5 cm delivered in 1 cm increments along the x-axis (crossline) (b) Depth profiles of the spots shown in (a) and (c) lateral profiles of the spots shown in (a).

