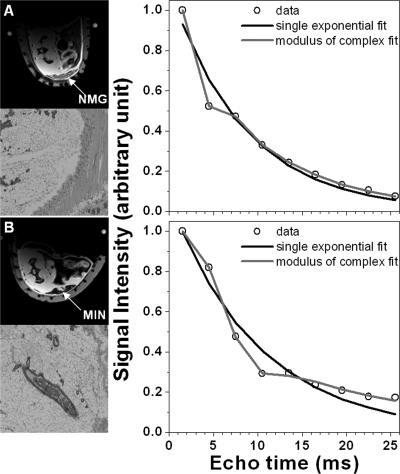
Figure 2.
Selected axial fat suppressed images of mammary glands from transgenic mice (left column top) and corresponding T2* curves (right column, data given by open circles) over the ROIs indicated by the arrow for: (a) normal mammary gland (NMG) tissue and (b) MIN lesion. H&E sections (left column bottom) are provided at 12.6× magnification. Normal mammary tissue and MIN data are fit by both single (dark line) and complex double (light line) exponential decay functions. The modulus of the complex double exponential decay function (light line) is clearly necessary to accurately model the FIDs that include a fat component.

