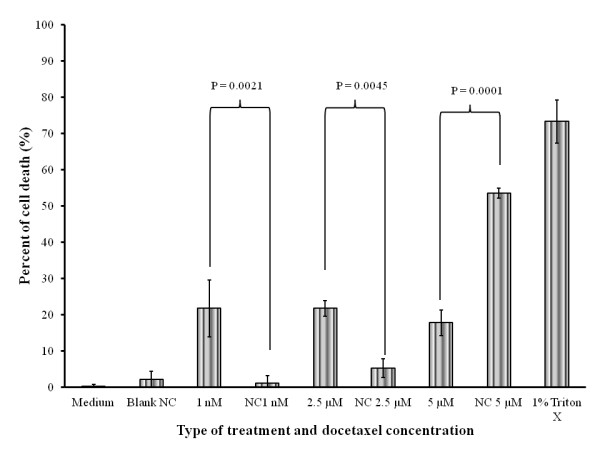
Figure 7.

Percent SUM 225 cell death by LDH assay after different treatments for 24 h. See text for details. Pairwise comparison: native drug versus drug loaded NCs at the same concentration. Data are expressed as mean percent ± SD from six measurements (n = 6).
