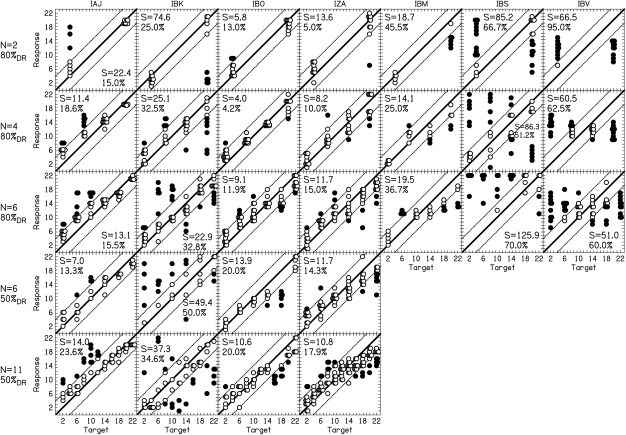
Figure 1.
Electrode responses as a function of target electrode for different number of electrodes (N) and stimulation levels. Each column represents a different listener. The solid line represents perfect electrode matching. The dotted lines show responses of ±4 electrodes; responses outside the dotted lines are shown with solid symbols and represent a “miss.” The second moment of the target-response difference (S) and the percentage of misses are reported in each panel.

