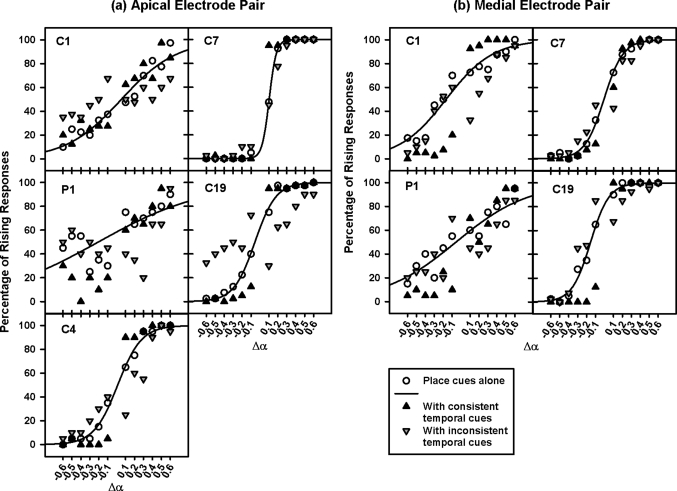
Figure 4.
Percentage of rising responses on the apical and the medial electrode pairs (left and right panels, respectively) as a function of Δα. The results from individual subjects are shown in different panels. The open circles, black upward triangles, and gray downward triangles show the data with place cues alone, consistent temporal cues, and inconsistent temporal cues, respectively. The solid curves show the best-fit sigmoid functions for the data with place cues alone.

