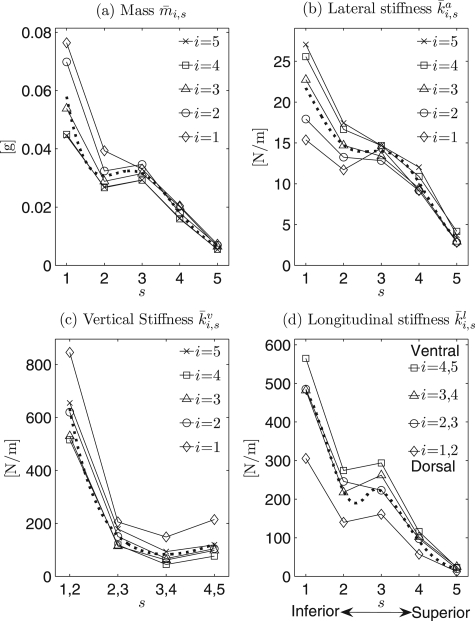
Figure 4.
(a) to (d) Charts for comparisons of mass and stiffnesses between different horizontal planes s., , , and denote the grand average values of mass, lateral stiffness, vertical stiffness, and longitudinal stiffness after applications of optimization procedure over all 24 hemilarynx experimental data sets, respectively. The dotted lines indicate the corresponding regressions for mass and different stiffness.

