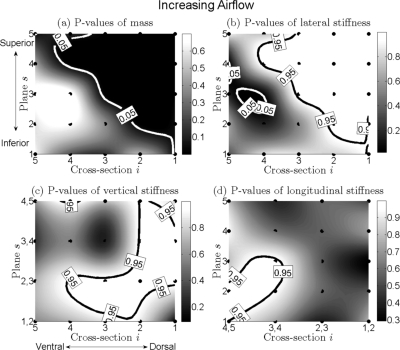
Figure 6.
(a) to (d) Charts for distributions of P-values of change of mass, lateral stiffness, vertical stiffness, and longitudinal stiffness of the vocal fold for increased airflow. They are on the basis of the optimization procedure to the 24 hemilarynx data sets. The black points are positions of different mass elements distributed across the vocal fold. Different gray levels correspond to different P-values of mass/stiffness. Dark gray level to light gray level denotes small value to large value. The black solid bold line indicates contour of P-value 0.95 (significant increase: P > 0.95), while the white solid bold line denotes contour of P-value 0.05 (significant decrease: P < 0.05).

