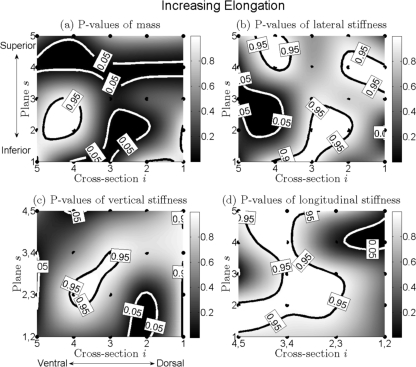
Figure 8.
(a) to (d) Charts for distributions of P-values of changing of mass, lateral stiffness, vertical stiffness, and longitudinal stiffness of the vocal fold for increased thyroid traction. Corresponding descriptions are shown in the caption of Fig. 6.

