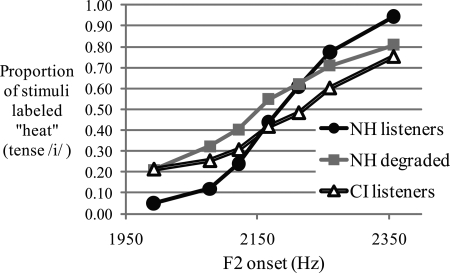
Figure 3.
Group mean response functions from 15 normal-hearing listeners and seven cochlear implant listeners along the continuum of vowel formant structure. Although these results are plotted by F2, the other formants were covarying (see Table TABLE II.).

