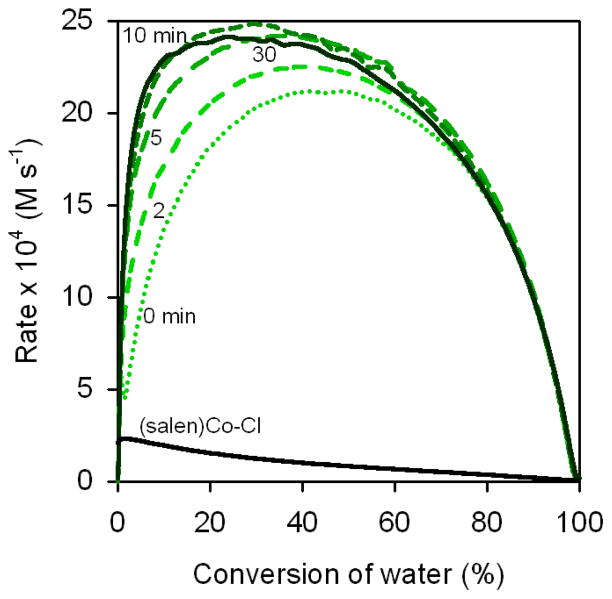
Figure 11.
Rate dependence on delay time between addition of 3d and water. Plot of the rates of hydrolysis of (R)-1,2-epoxyhexane ([epoxide]i = 5.4 M) in 1,2-hexanediol versus conversion of water ([H2O]i = 3.1 M) in 1,2-hexanediol. In each experiment, (S,S)-(salen)Co–Cl (0.15 mol %) was added to the reaction mixture and aged for 45 min, followed by 3d (0.15 mol %) as a solution in CH2Cl2; water was added subsequently after the indicated delay time. The black curve is derived from an experiment in which CH2Cl2 is added, but not 3d.

