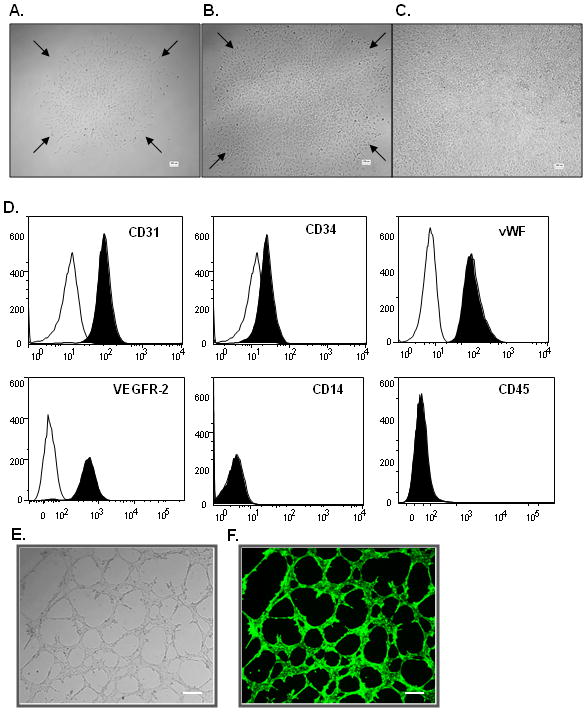
Figure 1.

Surface antigen profile and tube formation of outgrowth EPCs (native EPCs). (A, B) Representative light micrographs of outgrowing endothelial cell colonies derived from rat bone marrow mononuclear cells. (C) Confluent cell monolayer formed by outgrowth EPCs. Scale bar= 100μm. (D) Flow cytometry analysis showed that EPCs express CD31, CD34, vWF, and VEGFR-2, but not CD14 and CD45. (E) Representative light micrograph of tube-like structures formed by EPCs. Scale bar=50μm. (F) Representative fluorescent micrograph of tube-like structures stained with Calcein AM (viability dye). Scale bar= 50μm.
