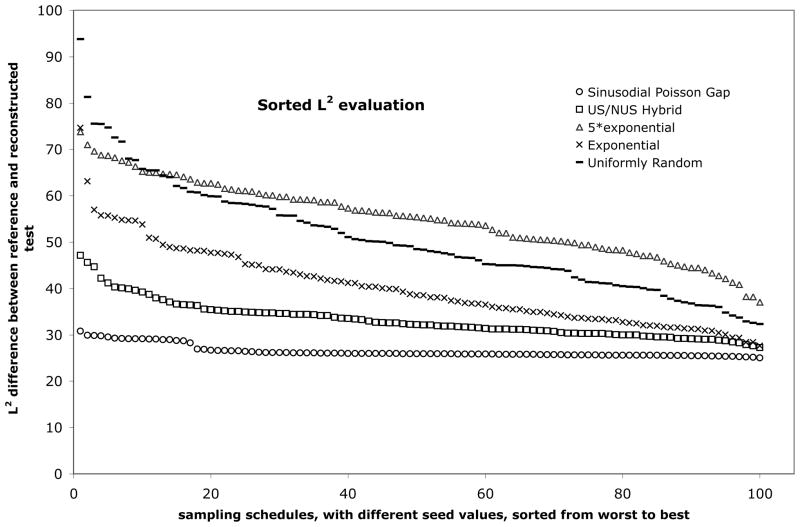
Figure 1.
Sorted L2 norm evaluation of five sampling strategies for non-uniform sampling of NMR data. The L2 norm ( ) in this case describes the deviation between the reference spectrum (a singlet with no line-width) and the FM reconstructed equivalent, when selecting 256 of 1024 complex data points in the time domain based on particular sampling strategy and seed value. 100 seed values were used to create 100 specific sampling schedules for each sampling strategy. The L2 values were hence sorted and the “best-of-100” (represented rightmost in the figure) and “worst-of-100” (represented leftmost) sampling schedules were identified for each strategy for further evaluation. (N.B. For practical use, only the “best-of-100” schedule would be of interest.)

