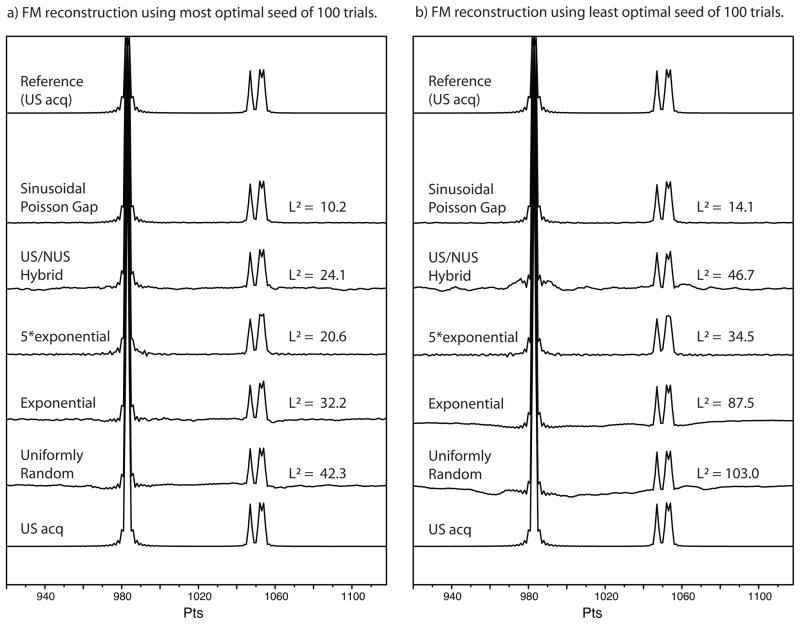
Figure 2.
Justification of prior selecting seed values and evaluation of sampling strategy based on a simulated spectrum with four signals, each simulated to been acquired to the equivalent of one T2 and with no noise. (I.e., the simulated FID decays to 1/e.) The intensity of the leftmost signal is tenfold that to each of the three others. (a) FM reconstruction using the sampling schedule based on labelled sampling schedules and seed value found to be “best-of-100” from previous evaluation (figure 1.) and (b) FM reconstruction using the sampling schedule based on labelled sampling schedules and using the seed value found to be “worst-of-100” from previous evaluation. The experience is described in the text.

