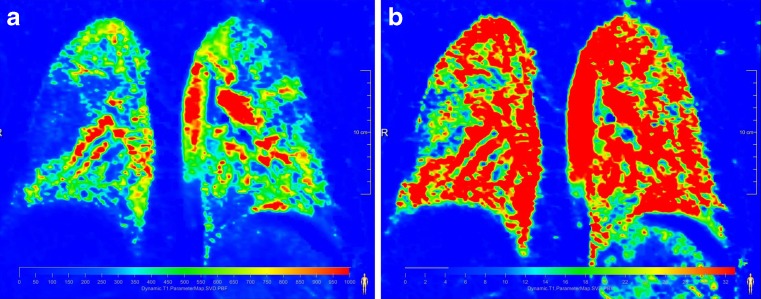
Fig. 4.
Same patient as in Fig. 3. Absolute quantification of perfusion parameters (a) pulmonary blood flow and (b) pulmonary blood volume. Especially the pulmonary blood flow nicely pronounces the area of the perfusion defect as well as the areas with reduced perfusion. Original perfusion-weighted data set (presented as maximum intensity projection) See Fig. 3

