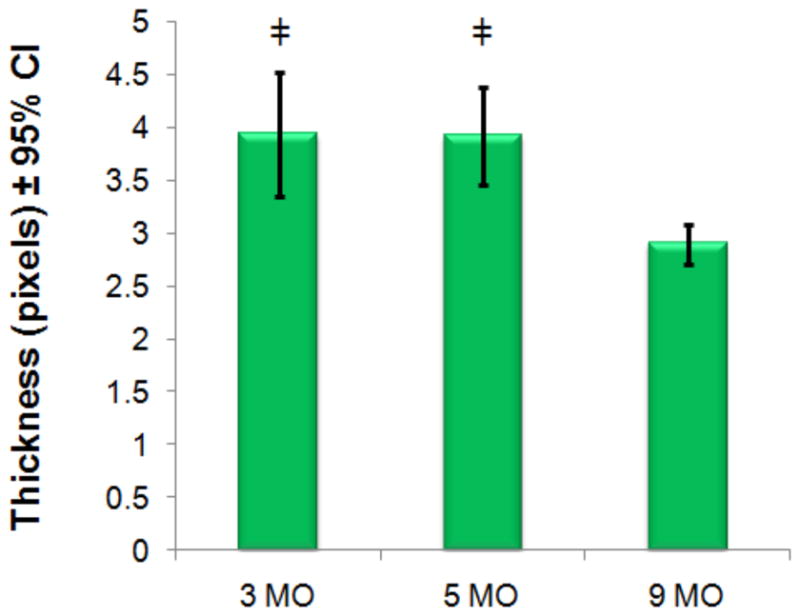
Figure 8.

Mean cartilage thickness measurements are plotted with 95% confidence intervals (CI). Values are recorded using T1-weighted MRI. There are significant differences (‡=p<0.01) between both the 3- and 5-month old animals compared to the 9-month cohorts but not between 3- and 5-month old cohorts.
