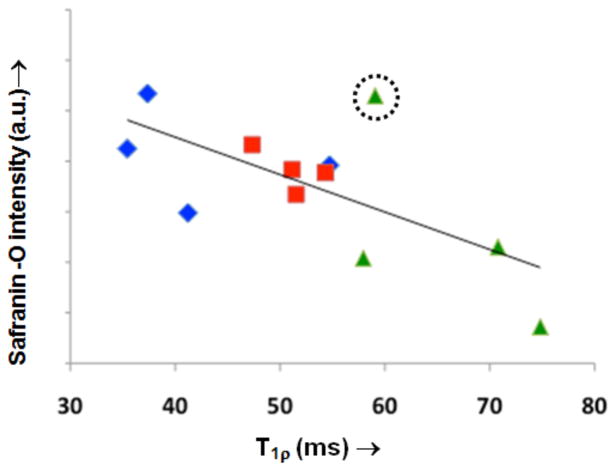
Figure 9.
Mean signal intensities from Safranin-O stained histology sections of each animal vs. their average T1ρ. Where
 =3-month,
 =5-month, and
 =9-month data. A moderate correlation (R2=0.44, p<0.01) exists but is improved (R2=0.67, p<0.01) if the outlier with abnormal and statistically significantly (z=−2.2) high stain intensity (indicated by dotted circle) is removed before analysis.

