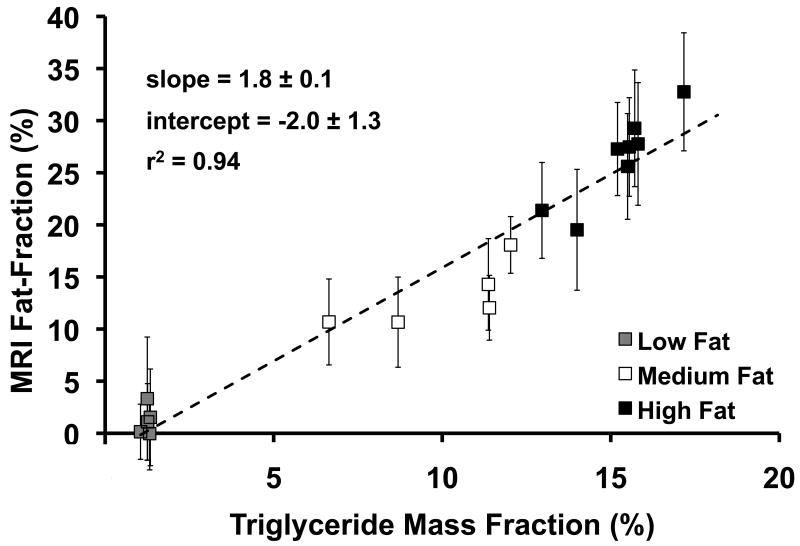
Figure 5.
MRI fat-fraction versus triglyceride mass fraction. MRI fat-fraction is predictive of the amount of triglycerides present in tissue. Clustering of each group of mice is seen, so low fat mice are displayed in gray, medium fat mice in white, and high fat mice in black. Dashed line is unity, and error bars represent standard deviation.

