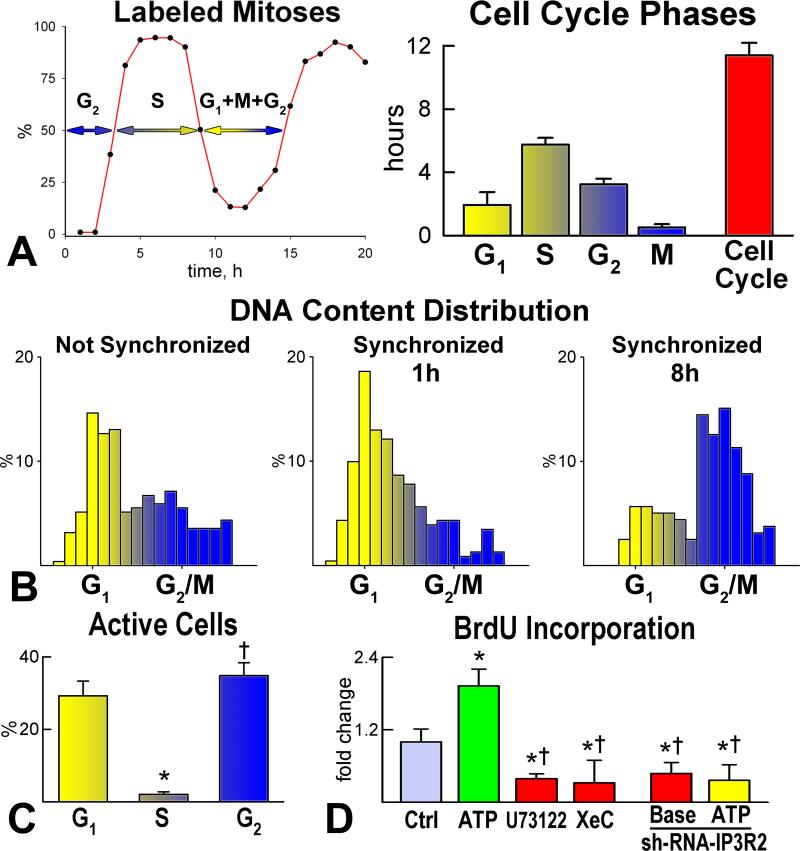
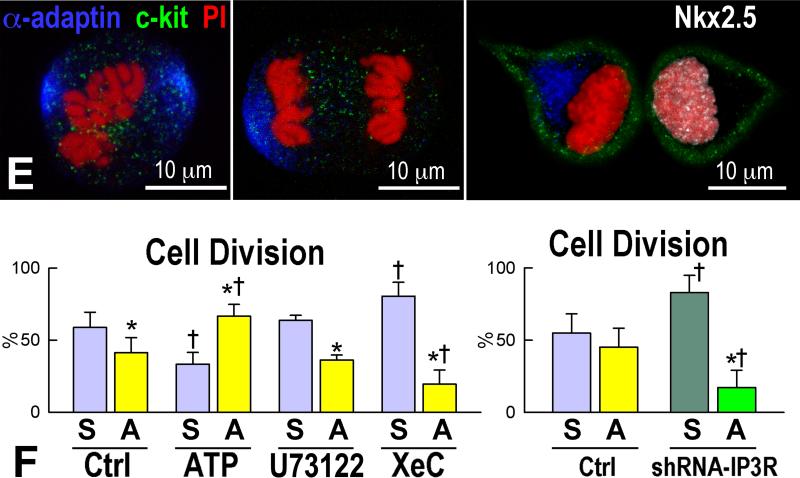
Figure 5.
Ca2+ oscillations and division of pCSCs A: Duration of the phases of the cell cycle in embryonic pCSCs. B: DNA content in embryonic pCSCs before synchronization, and 1 and 8 hours after cell synchronization in mitosis. C: Ca2+ oscillations in synchronized pCSCs during the different phases of the cell cycle. *,†P<0.05 vs. G1 and S, respectively. D: pCSCs synchronized in G1: Ca2+ oscillations induced by ATP favor cell replication, while inhibition of Ca2+ oscillations by U73122 and xestospongin-C (XeC), or reduced expression of IP3 receptor type-2 by sh-RNA have opposite effects. *,†P<0.05 vs. Ctrl and ATP alone, respectively. Baseline condition (Base): pCSCs infected with control vector. E: Symmetric (left) and asymmetric (central and right) division of pCSCs. Asymmetric division (right) results in the expression of Nkx2.5 in one of the two daughter cells. F: IP3 receptor function modulates the fate of dividing pCSCs. *,†P<0.05 vs. symmetric division (S) and Ctrl, respectively. A, asymmetric division.


