Figure 8.
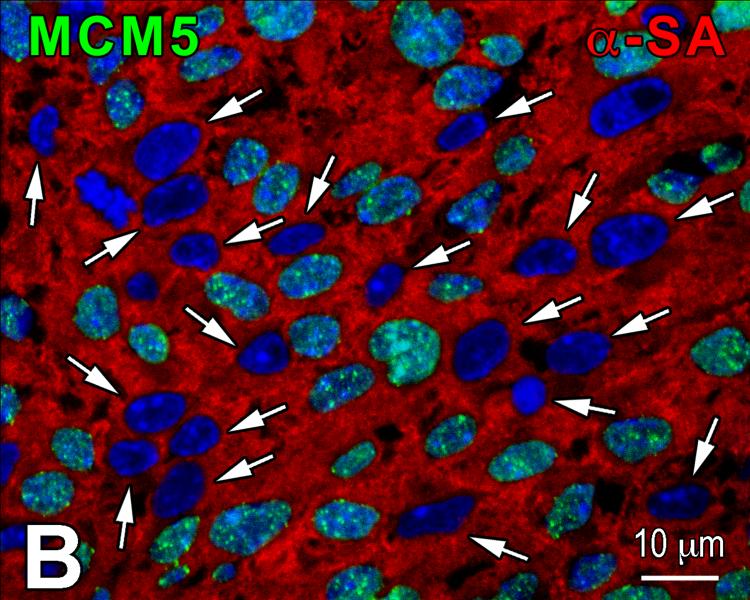
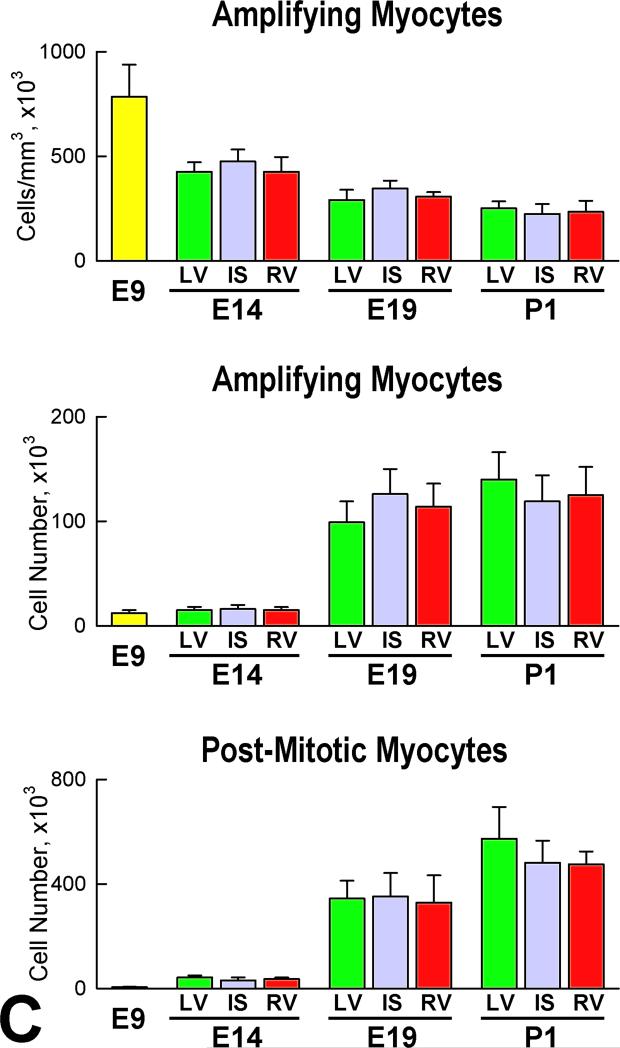
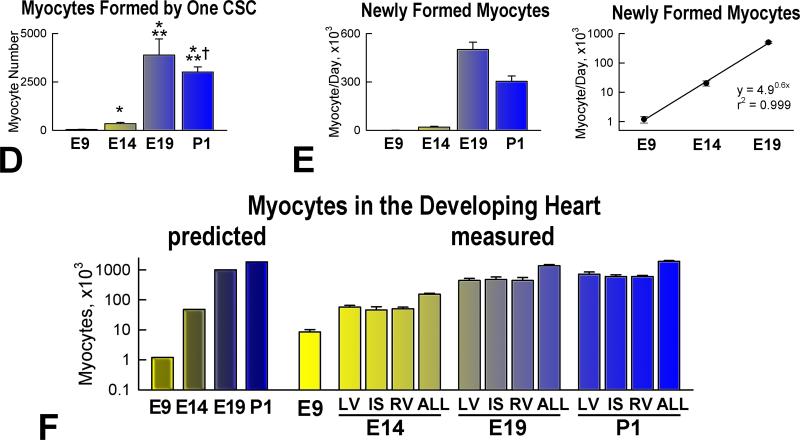
Myocyte formation. A: Amplifying myocytes (α-SA, red) are positive for MCM5 (left: green, arrows), phospho-H3 (central: white, arrows), and aurora B kinase (right: yellow, arrows). Cleavage furrow of the dividing cell: arrowhead. B: Post-mitotic myocytes are negative for MCM5 (arrows). C: Number of amplifying myocytes and post-mitotic myocytes in the heart, LV, IS, and RV at E9, E14, E19 and P1. D: Number of differentiated myocytes formed by one CSC. E: Number of differentiated myocytes formed per day. F: Predicted and measured number of myocytes in the entire heart, and in LV, IS, and RV at E9, E14, E19 and P1.


