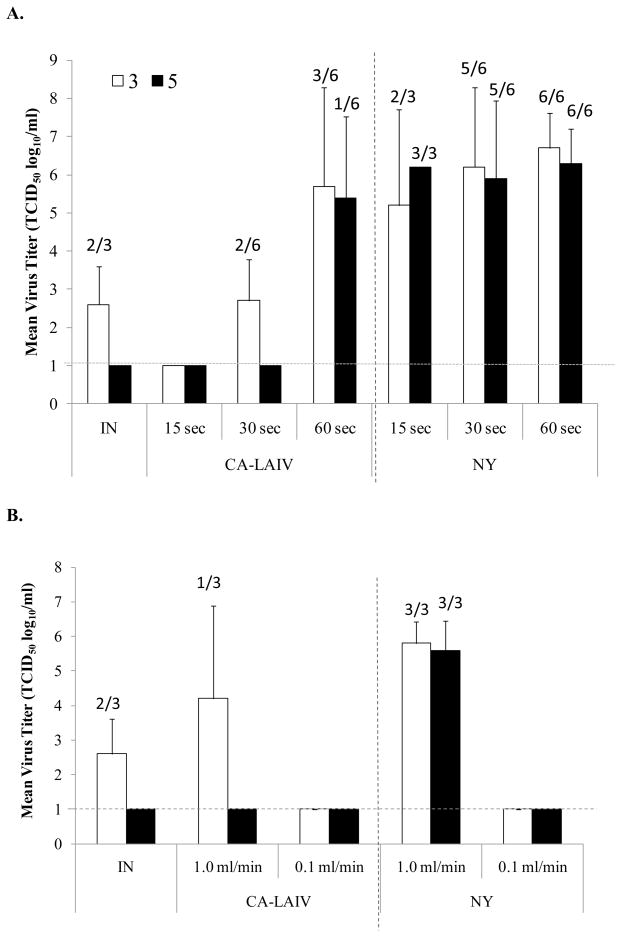
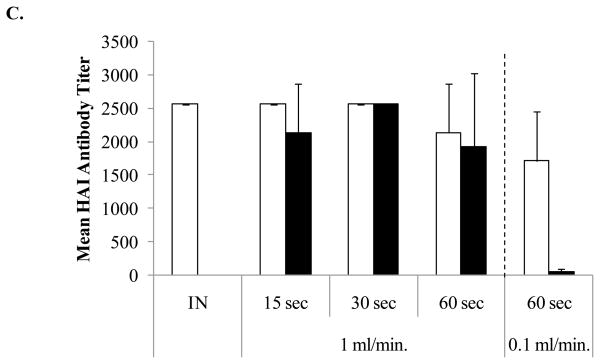
Figure 1.
Evaluating aerosol delivery parameters in ferrets using the AeroLife™ nebulizer. (A) Exposure time/volume. (B) Flow Rate. Black bars represent data for day 3 post exposure while open bars represent data for day 5 post exposure. (C) Mean serum HAI antibody response. Black bars represent mean titers for NY while open bars represent CA-LAIV. A minimum of three ferrets were used for each group. Ferrets were administered aerosol suspensions containing 103 TCID50/ml of virus. The limit of detection was 10 TCID50/ml. The numbers above each bar indicates the number of ferrets shedding virus out of the total number sampled.


