
FIGURE 6.
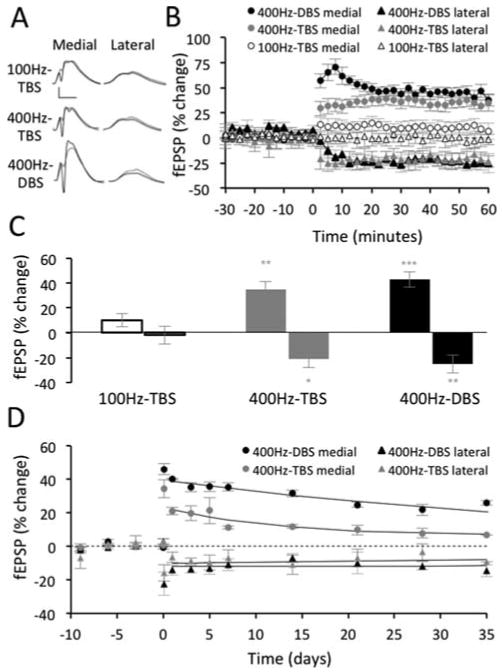
Effect of stimulation pattern on LTP and concurrent LTD. (A) Pre-HFS waveforms (dashed lines) are averages of 30 sweeps sampled immediately before HFS; post-HFS waveforms (solid lines) are averages of the final 30 sweeps obtained at 45 to 60 min. Scale bars: 5 mV, 5 μs. (B) Summary of the LTP and concurrent LTD measured from the final 10 min post-HFS for the three induction protocols. (C) The 400 Hz protocols produced greater LTP and concurrent LTD than 100 Hz-TBS (*P < 0.05, **P < 0.01, ***P < 0.001 displayed relative to 100 Hz-TBS). There was no significant difference between 400 Hz-TBS and 400 Hz-DBS. (D) LTP evoked by 400 Hz-DBS exhibited greater persistence than the LTP evoked by 400 Hz-TBS. The persistence of concurrent LTD did not differ between the two groups. LTP and concurrent LTD induced by 100 Hz-TBS was not sufficiently strong to warrant further analysis.