
Figure 10.
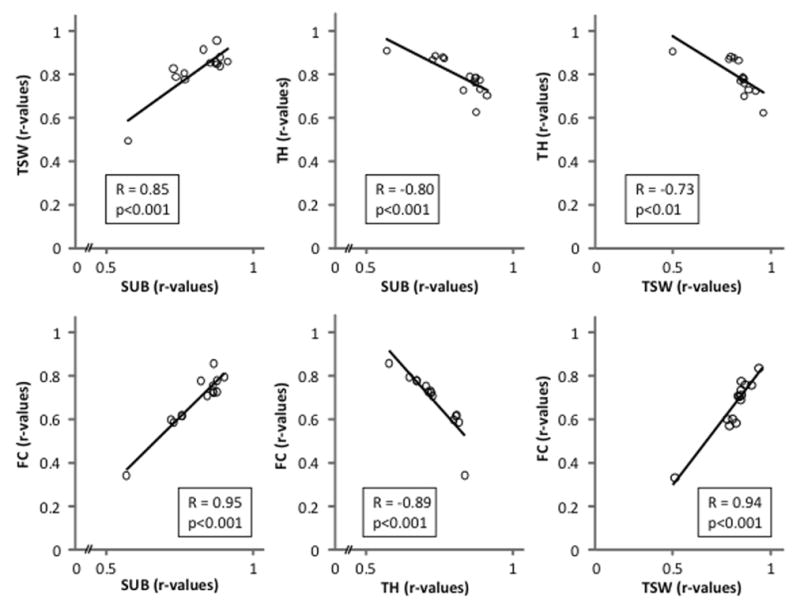
Potential cooperativity among brain regions during learning. Regression data in Fig. 9 were correlated among pairs of brain regions, with significant correlations shown here. Negative correlations suggest a systematic transition from brain networks involving nicotinic regulation of TH to those involving TSW, FC and SUB.