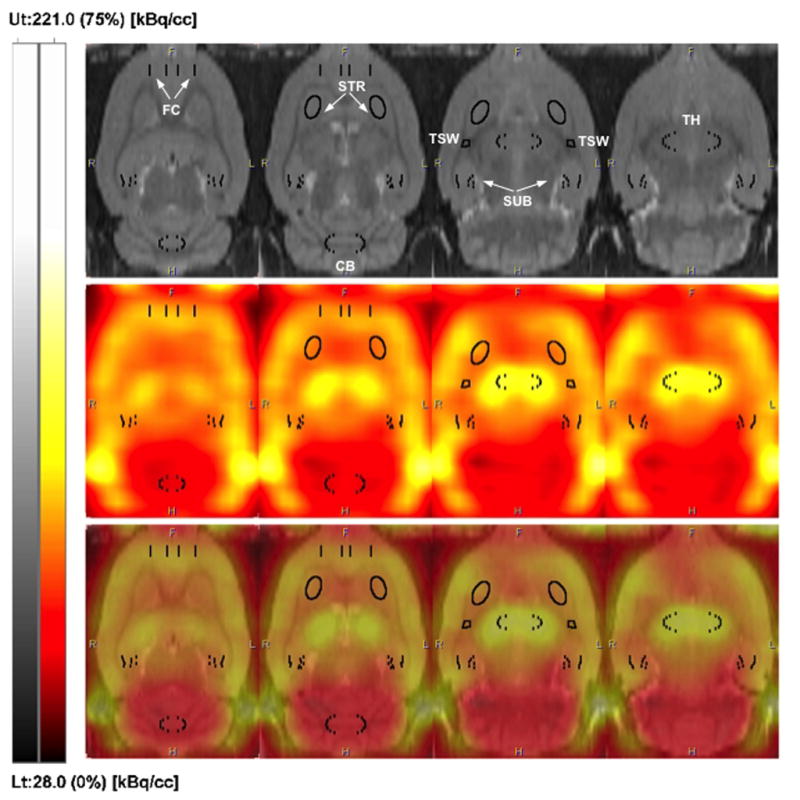
Figure 2.

PET imaging of 18F-nifene in rat brain. Representative horizontal sections of a rat brain MR template (upper panel), in vivo PET imaging of 18F-nifene (middle panel) and fused images (lower panel); coordinates with respect to bregma (left to right): −3.6, −4.4, −5.4 and −6.0 mm. PET images were integrated over 5–30 min interval, and the intensity was scaled relative to the whole image volume (upper threshold set to 75%). VOI placements on FC, STR, SUB, TSW and CB are shown on each panel, with labels on MR template. VOIs for TSW and STR were placed on the horizontal slices of the MR template. All other VOIs were placed on the axial slices.
