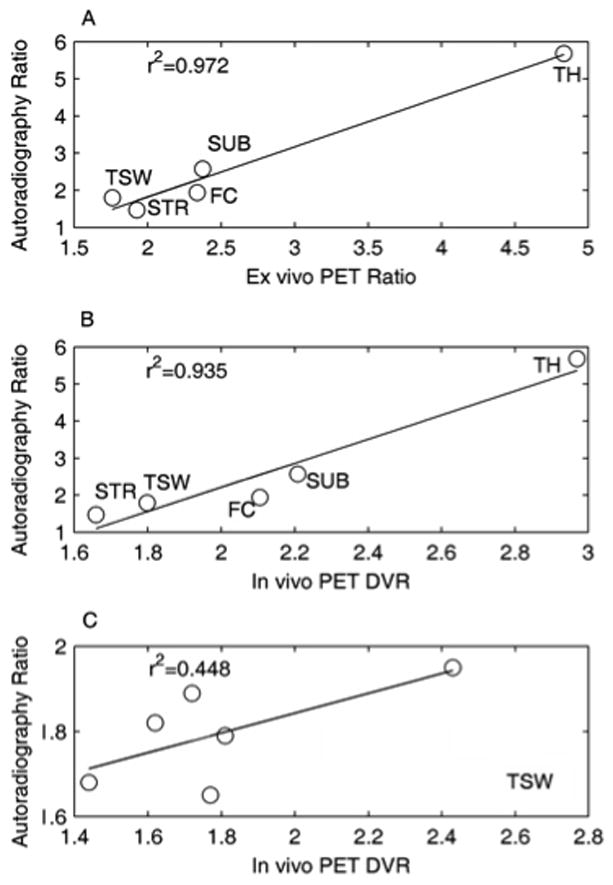
Figure 5.

Correlation of 18F-nifene autoradiography to ex vivo PET (A) and in vivo PET (B) measures. Each data point represents an average of six animals, with CB in each animal used as a reference to normalize binding across animals. (C) Correlation of binding estimates from autoradiography vs. in vivo PET for TSW in six animals.
