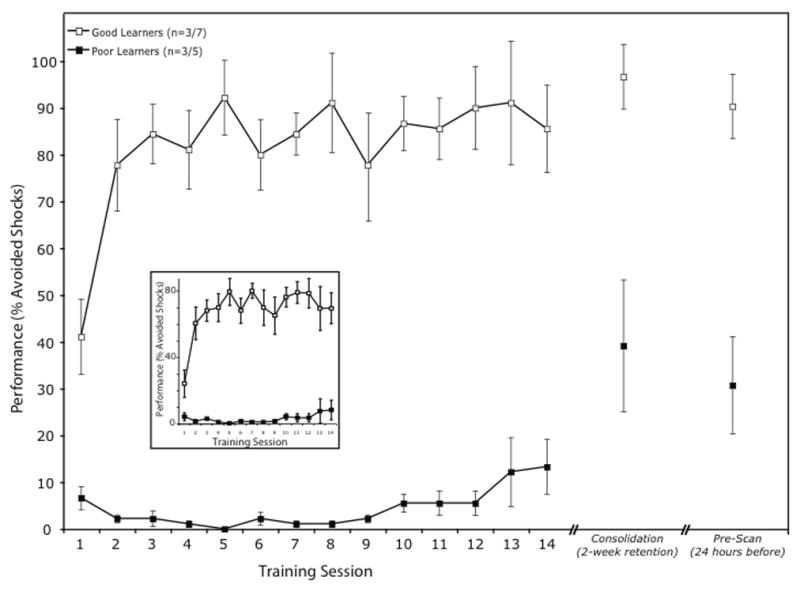
Figure 7.

Behavioral performance in an auditory-cued, active avoidance task over 14 days of training, followed by a retention test after two weeks, and a final test after variable delay before PET session. Performance is shown as mean (± sem) percentage of avoided shocks for the best- (n = 3) and worst- (n = 3) perfor ming animals; inset shows data for all 12 animals tested, separately for those that learned (n = 7) or did not (n = 5; see text for learning criterion).
