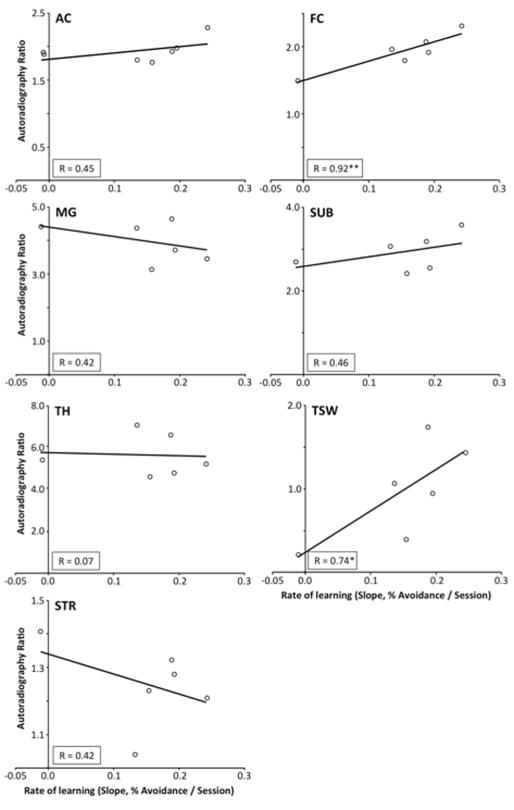
Figure 8.
Relation between 18F-nifene binding in seven forebrain subregions and of initial learning rate for the three best- and three worst-performing animals. Autoradiographic binding was determined after all testing was completed, and was correlated with initial rate of learning (Table II, column 1), as an example of the analyses presented in Table II. Regression coefficient, R; *p < 0.05, or **p < 0.01).

