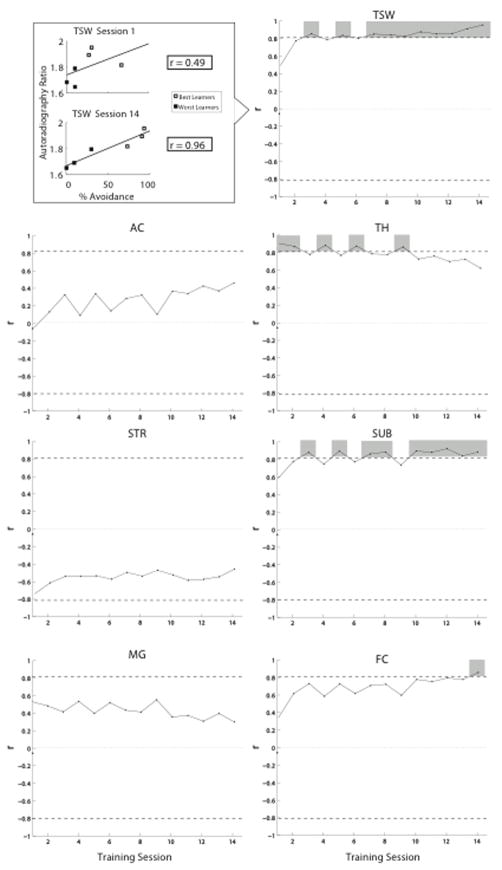
Figure 9.
Correlation of behavioral performance on each day of training with 18F-nifene binding in forebrain subregions determined after all testing was completed. Data are for the 3 best- and 3 worst-performing animals (see top left for example, TSW binding vs. performance on training days 1 and 14; autoradiography ratio is binding relative to CB in the same animal). For each forebrain region, regression coefficients are plotted for each day; dashed line indicates threshold for significance (p = 0.05).

