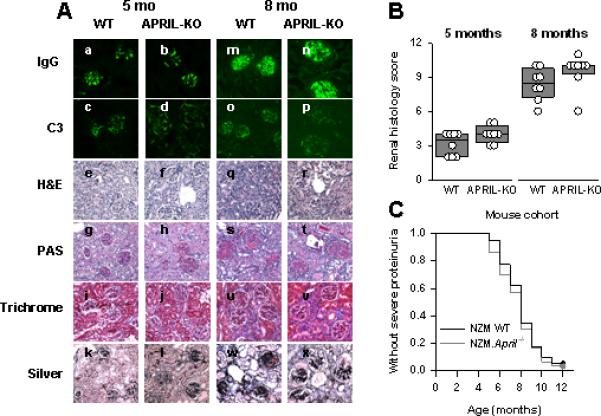
Figure 3. Renal immunopathology and clinical disease in WT and NZM.April-/- mice.

Panel A: Kidney sections from 5-month-old (a-l) or 8-month-old (m-x) WT (a, c, e, g, i, k, m, o, q, s, u, w) or NZM.April-/- (APRIL-KO; b, d, f, h, j, l, n, p, r, t, v, x) mice were stained for IgG (a, b, m, n) or C3 (c, d, o, p) immunofluorescence or were stained with H&E (e, f, q, r), PAS (g, h, s, t), Masson's trichrome (Trichrome; i, j, u, v), or Jones’ silver methenamine (Silver; k, l, w, x) for histological evaluation. Representative sections are illustrated. Panel B: The renal histology scores for the 8 mice in each cohort are plotted as in Figure 1. Panel C: WT (n = 40) and NZM.April-/- (n = 30) mice were monitored for 12 months for development of severe proteinuria. Data are plotted as the fraction of mice over time that did not develop severe proteinuria.
