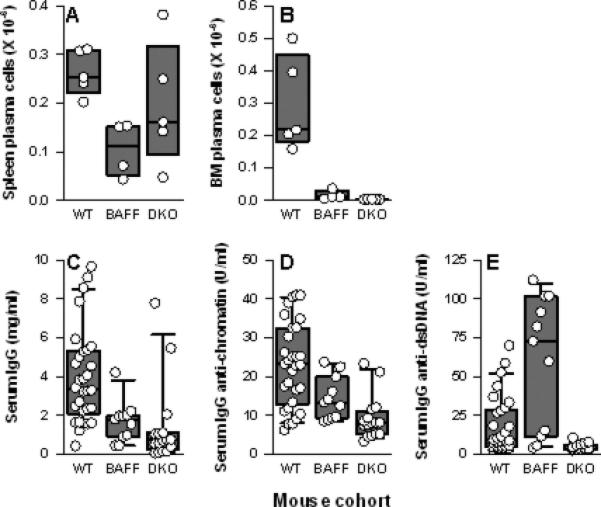
Figure 4. Spleen and BM PC and serum total IgG and IgG autoantibody levels in NZM WT, NZM.Baff-/-, and NZM.Baff-/-.April-/- mice.

Spleen PC (panel A) and BM PC (panel B) from NZM WT (WT; n = 5), NZM.Baff-/- (BAFF; n = 4), and NZM.Baff-/-.April-/- mice (DKO; n = 5) are plotted as in Figure 1. Serum levels of total IgG (panel C), IgG anti-chromatin (panel D), and IgG anti-dsDNA (panel E) from WT (n = 30), NZM.Baff-/- (n = 11), and NZM.Baff-/-.April-/- mice (n = 16) are plotted as in Figure 1. (WT data are identical to those presented in Figure 2 and are included for clarity.)
