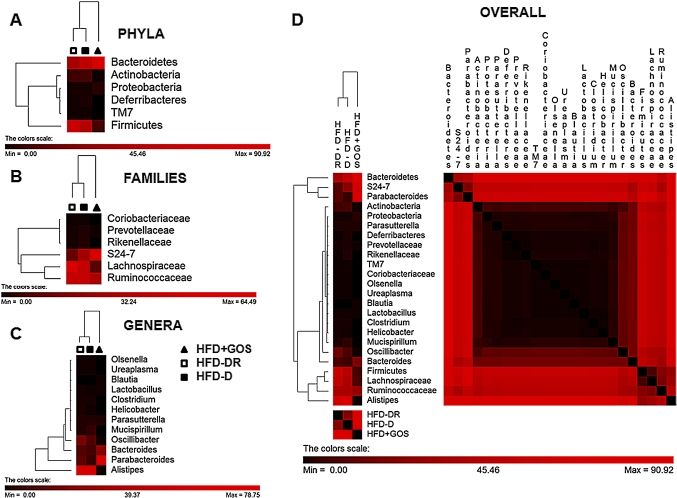
Figure 4.
Cluster identification of gut microbial profiles of the different metabolic phenotypes: (A) phyla, (B) families, (C) genera and (D) overall taxa shown according to metabolic phenotypes for mice fed a high-fat diet (HFD) that became diabetic (HFD-D, closed squares), diabetes-resistant mice (HFD-DR, open squares) and mice fed a diet supplemented with gluco-oligosaccharides (HFD+GOS, closed triangles). Pearson tree analysis was performed to cluster groups (top) and taxa (left side) of each heat map.

