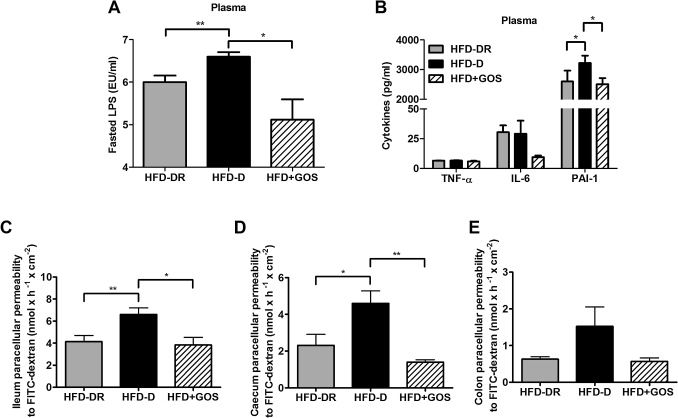
Figure 5.
Plasma inflammation and gut paracellular permeability. (A) Fasting plasma lipopolysaccharide (LPS) levels, (B) cytokine concentrations in plasma and (C–E) intestinal paracellular permeability in the ileum (C), caecum (D) and colon (E) in mice fed a high-fat diet (HFD) that became diabetic (HFD-D), diabetes-resistant (HFD-DR) and in mice fed a diet supplemented with gluco-oligosaccharides (HFD+GOS). Data are shown as mean ± SEM; *p<0.05, **p<0.01 (unpaired Student t test; n=6–12 per group). IL, interleukin; PAI-1, plasminogen activator inhibitor 1; TNFα, tumour necrosis factor α.

