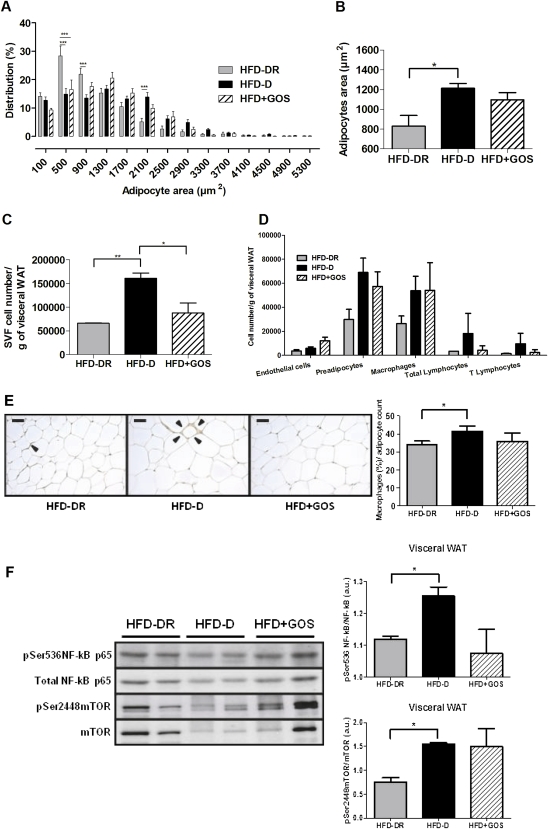
Figure 6.
Cell architecture and inflammation in visceral white adipose tissue (WAT). (A) Adipocyte area and distribution, (B) mean adipocyte area, (C) total cell count of the stroma vascular fraction (SVF)/g visceral WAT, (D) endothelial (CD31+), preadipocytes (CD34+), macrophages (F4/80/CD11b+), total lymphocytes and T cells (CD3+), (E) macrophage immunostaining and number (%) per adipocyte count, (F) western blot analysis of phosphorylated and total proteins involved in inflammatory pathways in mice fed a high-fat diet (HFD) which became diabetic (HFD-D), diabetes-resistant (HFD-DR) and mice fed a diet supplemented with gluco-oligosaccharides (HFD+GOS). Data are shown as mean ± SEM; *p<0.05, **p<0.01, ***p<0.001 (unpaired Student t test; n=5–12 per group).

