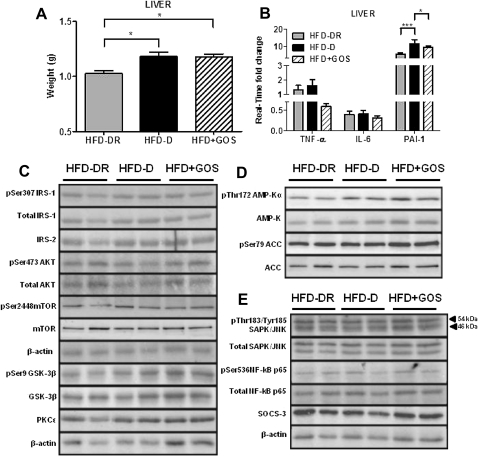
Figure 7.
Liver weight, inflammation, insulin and energy pathways during metabolic adaptation. (A) Liver weight; (B) TNFα, IL-6 and PAI-1 mRNA concentrations; (C–E) western blot analysis of phosphorylated and total proteins involved in (C) insulin signalling, (D) energy metabolism and (E) inflammation from mice fed a high-fat diet (HFD) which became diabetic (HFD-D), diabetes-resistant (HFD-DR) or mice fed a diet supplemented with gluco-oligosaccharides (HFD+GOS). Data are shown as mean ± SEM; *p<0.05, ***p<0.001 (unpaired Student t test; n=4 per group). IL, interleukin; PAI-1, plasminogen activator inhibitor 1; TNFα, tumour necrosis factor α.

